
PROJECT REPORT
Pig Rearing

| NABARD Model Project on Pig Breeding Farm (20 sows and 4 boars) | |||
| A. Project at a glance | |||
| 1 | Unit Size | 20 sows and 4 boars | |
| 2 | Type of Animal | Crossbred Sows and Exotic Boars | |
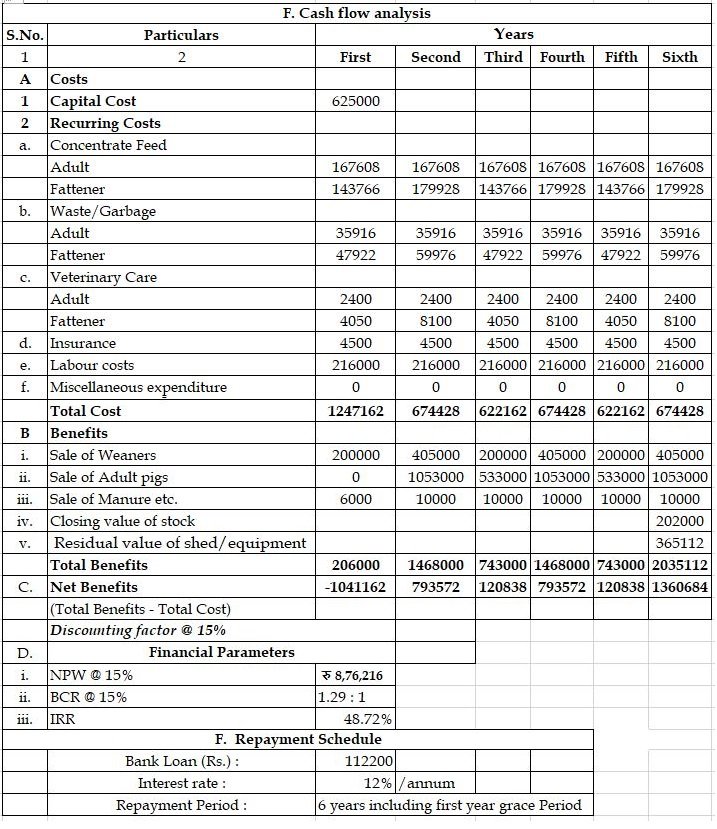
| 3 | Total Financial Outlay /Unit cost (Rs.) | 1247000 | |
| 4 | Margin Money- minimum 10% (Rs.) | 125000 | |
| 5 | Bank Loan (@90% of TFO) (Rs.) | 1122000 | |
| 6 | Repayment period (Years) | 6 years including 1 year grace period | |
| 7 | Interest rate (% p.a.) | 12% | |
| 8 | NPW @ 15% DF (Rs.) | रु 8,76,216 | |
| 9 | BCR @ 15% DF | 1.29:1 | |
| 10 | IRR (%) | 48.72% | |
| B. Investment cost | |||||
| S. No. | Item | Specifications | Physical Unit | Unit Cost (Rs./Unit) | Total Cost (Rs.) |
| 1 | Pig Sty | ||||
| i | Boar Pens | 70 sqft/ boar | 280 | 250 | 70000 |
| ii | Sow Pens | 20 sqft/sow for 15 sows | 300 | 250 | 75000 |
| iii | Farrowing Shed | 100 sqft/sow for 5 sows | 500 | 250 | 125000 |
| iv | Gorwers’ Shed | 10 sqft/grower | 820 | 250 | 205000 |
| 2 | Equipment | LS | 30000 | ||
| 3 | Water Supply, Bio-security, etc. | 30000 | |||
| 4 | Cost of pigs | ||||
| i | Sow | Improved | 20 | 3500 | 70000 |
| ii | Boar | Improved | 4 | 5000 | 20000 |
| 5 | Feed | Kg | |||
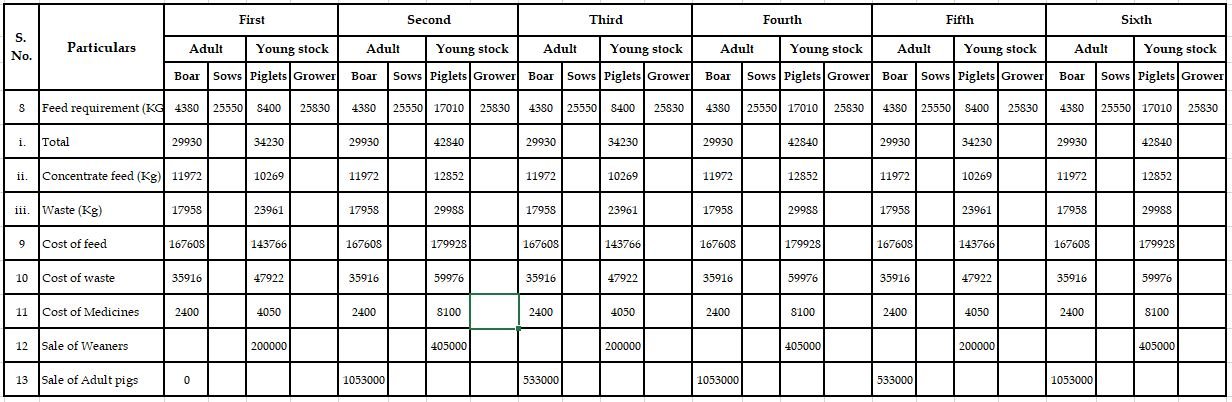
| i | Adult (Feed for one year) | 3/kg/day/boar | 4380 | ||
| 3.5/kg/day/sow | 25550 | ||||
| 40% conc. feed | 11972 | 14 | 167608 | ||
| 60% waste | 17958 | 2 | 35916 | ||
| ii | Growers (Feed for six months) | 1.75 kg/fattener – 162 nos | 34230 | ||
| 30% conc. feed | 10269 | 14 | 143766 | ||
| 70% waste | 23961 | 2 | 47922 | ||
| 6 | Insurance | 5% of value of animals | 5% | 4500 | |
| 7 | Labour | 3 persons for 12 months | 3 | 6000 | 216000 |
| 8 | Cost of Medicines | @ Rs.100 per adult | 24 | 100 | 2400 |
| @ Rs.25 per fattener | 162 | 25 | 4050 | ||
| Total | 1247162 | ||||
| Total Investment Cost (Rounded) | 1247000 | ||||
| C. Techno-Economic Parameters | ||
| 1 | Space requirement for shed (sft) | Specifications |
| i. | Boar | 70 sqft for Rs.250/sft |
| ii. | Sow | 20 sqft for Rs.250/sft |
| iii. | Farrowing pens | 100 sqft for Rs.250/sft |
| iv. | Growers 3-8 months | 10.0 sqft @ 250/sqft |
| 2 | Farrowing details | |
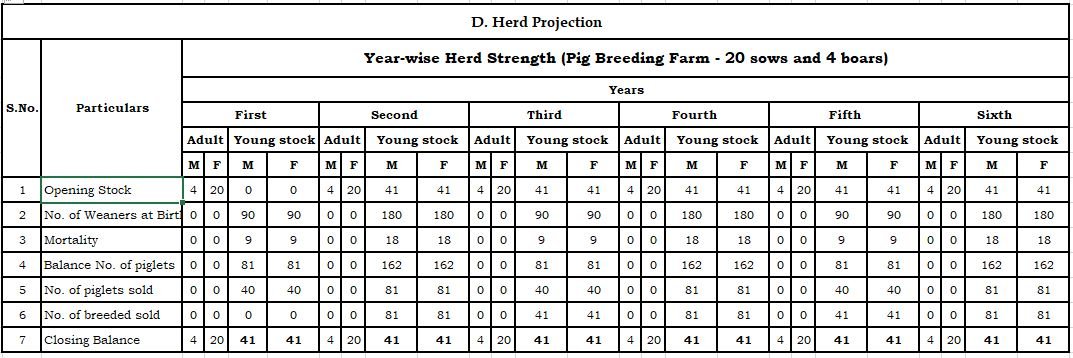
| i. | Farrowing Interval (months) | 8 (three farrowings in two years) |
| ii. | No. of piglets per sow | 9 |
| iii. | Mortality among piglets (%) | 10% |
| iv. | Weaning period (days) | 60 |
| 3 | Feed requirement : kg/day | |
| i. | Boar | 3 |
| ii. | Sow | 3.5 |
| iii. | Grower (Average) | 1.75 |
| iv. | Ratio of concentrate to total feed | 40% to breeding stock |
| 30% to grower | ||
| v | Cost concentrate feed (Rs./kg) | 14 |
| vi. | Cost of waste (Rs./kg) | 2 |
| 4 | Cost of animals at purchase | |
| i. | Sow – 6 months age (Rs.) | 3500 |
| ii. | Boar – 6 months age (Rs.) | 5000 |
| 5 | Insurance (% of value) | 5 |
| 6 | Labour | 3 persons for 1st 12 months |
| 7 | Cost of medicine, vaccine etc. | |
| For adult (Rs./pig) | 100 | |
| For fattener (Rs./pig) | 25 | |
| 8 | Sale price of 2 months old piglet for rearing | 2500 |
| Sale of breeders | 50% | |
| 9 | Sale price of 8 months old pigs for breeding | 6500 |
| Sale of breeding pigs | 100% | |
| 10 | Salvage Adult (Rs. Per pig) | 5000 |
| Value Piglets (Rs. Per pig) | 1000 | |
| 11 | Depreciation (%) | |
| i | Civil Structures | 5% |
| ii | Equipment | 10% |
E. Expenditure for feed and medicine and income from sale of weaners and adult pigs
| Year | Loan Outstanding | Gross Surplus | Repayment | Net Surplus | ||
| Interest | Principal | Total | ||||
| 1 | 1122000 | -1041162 | 134640 | 0 | 0 | 0 |
| 2 | 1122000 | 793572 | 134640 | 195720 | 465000 | 328572 |
| 3 | 926280 | 120838 | 111154 | 8846 | 120000 | 838 |
| 4 | 917434 | 793572 | 110092 | 354908 | 465000 | 328572 |
| 5 | 562526 | 120838 | 67503 | 52497 | 120000 | 838 |
| 6 | 510029 | 793572 | 61203 | 510029 | 571232 | 222340 |
| # one farrowing in first, third and fifth year and two farrowings in second, fourth and sixth year results in fluctuating flow of income. | ||||||
| Depreciated value of sheds and equipments | ||||
| Shed | Equipment | |||
| Depreciation | 5.00% | 10.00% | ||
| Value | ||||
| 475000 | 30000 | |||
| Year 1 | 23750 | 451250 | 3000 | 27000 |
| Year 2 | 22563 | 428688 | 2700 | 24300 |
| Year 3 | 21434 | 407253 | 2430 | 21870 |
| Year 4 | 20363 | 386890 | 2187 | 19683 |
| Year 5 | 19345 | 367546 | 1968 | 17715 |
| Year 6 | 18377 | 349169 | 1771 | 15943 |